The Renewables and Wholesale Electricity Prices (ReWEP) visualization tool from Berkeley Lab now includes nodal electricity pricing and wind and solar generation data through the end of 2023. Access it here: ReWEP Tool.

ReWEP users can explore trends in wholesale electricity prices and their connection to wind and solar generation. The tool features nodal pricing trends across various locations, regions, and timeframes. It includes maps, time series, and other interactive figures that provide: (1) an overview of how average pricing, negative price frequency, and extreme high prices change over time, and (2) a summary of how pricing patterns relate to wind and solar generation.
Source: Berkeley Laboratory
Users can investigate by year, season, time of day, and region, defined by Independent System Operators (ISO) or Regional Transmission Organizations (RTO) regions. ReWEP also includes prices from the Western United States’ Western Energy Imbalance Market and Western Energy Imbalance Service Market.
Many users have requested the ability to download the underlying data from ReWEP. Although a commercial data agreement restricts us from sharing all input data, we have added an option to download much of the aggregated data shown in the figures. To download the data, scroll to the bottom of the ReWEP tool and click the download link.
Technical Brief on Notable Trends in 2023
Alongside the data update, we published a technical brief summarizing key trends in pricing and wind and solar generation from the past year. Access the full brief here: Technical Brief.
A preview of the brief includes:
Introduction
Various factors, including the increasing presence of wind and solar power, influence wholesale electricity prices.
Generation costs, often influenced by fuel prices (particularly natural gas), and high demand levels driven by hot weather (such as air conditioning use) or tight markets where demand nearly matches available supply, act as key market forces.
Wind and solar power can reduce prices because (1) their production can coincide in a specific area, like during a large wind event; (2) their output can be limited by insufficient transmission infrastructure, leading to localized low or negative prices; and (3) their output can sometimes be high relative to demand, such as solar power on cool spring afternoons.
By monitoring average prices, instances of very high prices, and the frequency of negative prices, along with wind, solar, and overall electricity demand, ReWEP effectively illustrates these dynamics.
2023 Wholesale Electricity Prices Declined Compared to 2021 and 2022
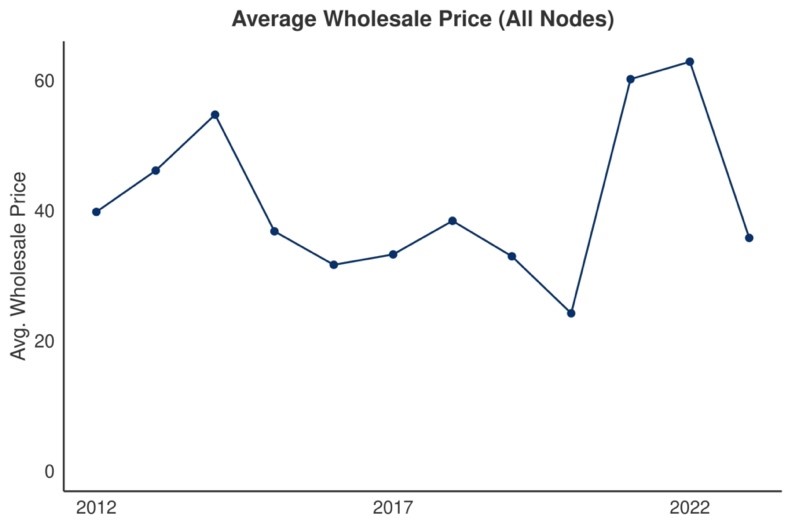
Figure 1, available on ReWEP, indicates that the average price in 2023 was $36/MWh, a decrease from $63/MWh in 2022. One significant factor behind this drop was the declining cost of natural gas.
According to the Energy Information Administration (EIA), natural gas prices fell from $6.45 in 2022 to $2.54 in 2023, based on the annual average per Million Btu spot price at the Henry Hub.
Natural gas prices fluctuate due to global, domestic, and regional factors, and the high prices in 2021 and 2022 resulted partly from the invasion of Ukraine, sanctions on Russia, and the impacts of the Covid pandemic. These high natural gas prices contributed to the spike in wholesale electricity prices during those years, but prices decreased in 2023.
Regional Price Variations
Figure 2 illustrates that average annual prices in ERCOT (Texas), CAISO (California), and the broader western region were relatively high compared to other regions in the country.
In contrast, prices in SPP (the region in the center of the country) were particularly low, with the lowest prices occurring in areas with the highest levels of wind generation.
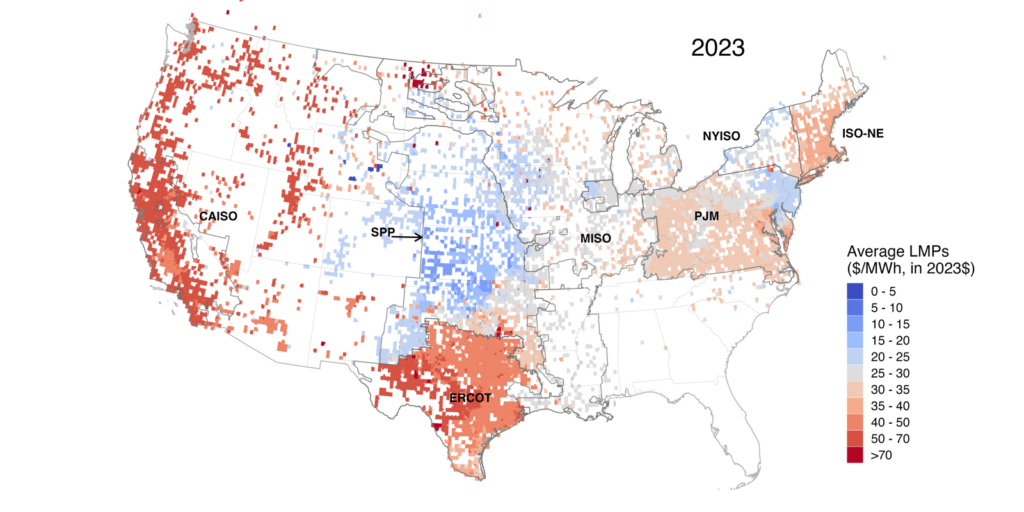
High wholesale electricity prices in ERCOT and CAISO stemmed from different causes. In CAISO, high annual prices in 2023 were primarily due to elevated hourly prices in January.
Conversely, in ERCOT, high annual prices in 2023 resulted from increased afternoon and early evening prices from June through September (Figure 3).
These elevated prices were driven by record-high electricity demand, partially due to record summer heat in Texas in 2023. The full brief provides further discussion on the pricing patterns in both CAISO and ERCOT.
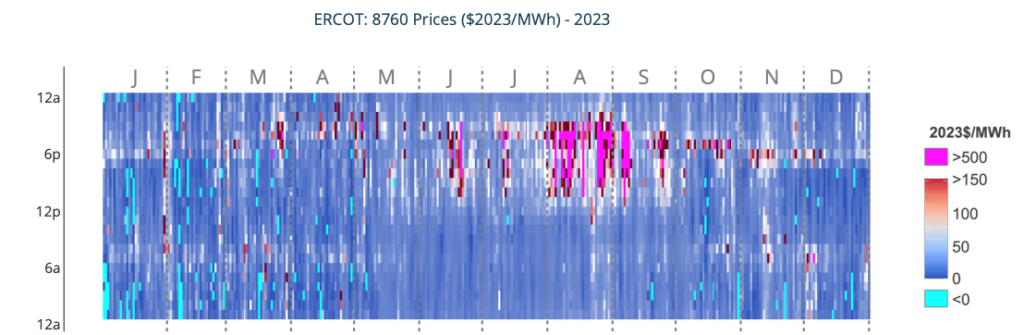
Figure 3. ERCOT (Texas) Price Trends. In summer, ERCOT prices peaked during early evenings due to high electricity demand, primarily from air conditioning. The high price caps in the Texas market encourage new supply and lower demand. Negative prices, shown in light blue, occur in winter when wind power is high, and demand is low. This ReWEP screenshot shows the regional average hourly price by day and hour (365×24).
ReWEP allows users to explore how renewable generation and electricity demand influence prices. These relationships are detailed further in the full brief.
- ReWEP: Renewables and Wholesale Electricity Prices
- Technical Brief on 2023: Link to Technical Brief